3.4. Meta-Analysis
3.4.1. Introduction
This screen summarizes the published scientific evidence for the selected Intraocular Lens or Functional Vision category for the outcome of interest allowing to access to the pooled mean of studies before a peer review Meta-Analysis is published.
It helps you answer four main questions:
How does the IOL usually perform for the chosen outcome?
How precise is that estimate?
How much do results vary between studies?
How strong is the overall evidence base?
 | How to access this viewThis view can be accessed from any grouped report list or directly from the comparison box, once two or more studies have been selected for comparison. What can be seenDepending on the nature of the outcome, the analysis computes either a pooled mean for continuous variables or a pooled proportion/ratio for dichotomous variables. The meta-analysis option becomes available only when two or more studies report the same clinical outcome. It is important to note that this feature performs the statistical pooling of results only. A complete meta-analysis requires a prior systematic review. |
|---|
3.4.2. Select the Outcome
IOLEvidence can compute either the pooled mean or rate depending on the characteristics of the outcomes (continuous values, such as logMAR for visual acuity) or percentages (for percentage of patients achieving a particular level of visual acuity or patient reported outcomes such as Spectacle Independence, Dysphotopsia, and others).
Once selected an Outcome from the drop-down list, the particular end-point should be selected. For instance, in the case of Monocular Efficacy, the following endpoints are available.
CDVA: Monocular Distance Corrected Visual Acuity
DCIVA: Distance Corrected Intermediate Visual Acuity
DCNVA: Distance Corrected Near Visual Acuity
When you change the Outcome Category and End-Point, all the statistics are recalculated and shown for that specific end-point.
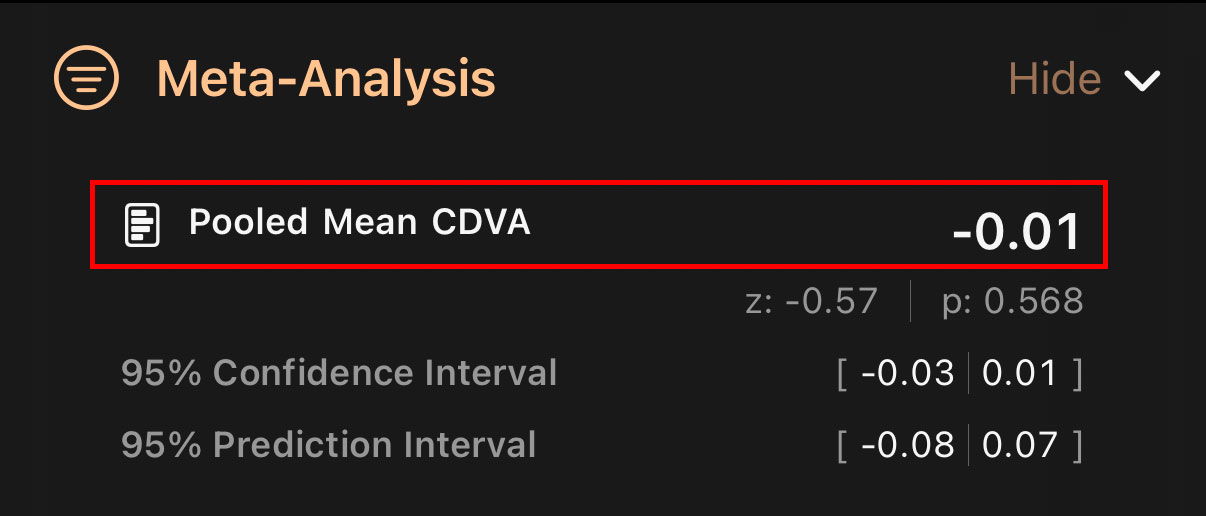
3.4.3. Combined Mean Result
This is the overall average result for the selected outcome, obtained by pooling all included studies.
What it means:
It answers: “On average, across the literature, how does this lens perform for this outcome?”
It is the central summary of performance, instead of looking at each study separately.
What it’s for:
To give you a quick, global impression of the lens’ typical performance.
To support comparisons between lenses on the same outcome.
3.4.4. 95% Confidence Interval
The confidence interval shows a lower and upper limit around the combined mean.
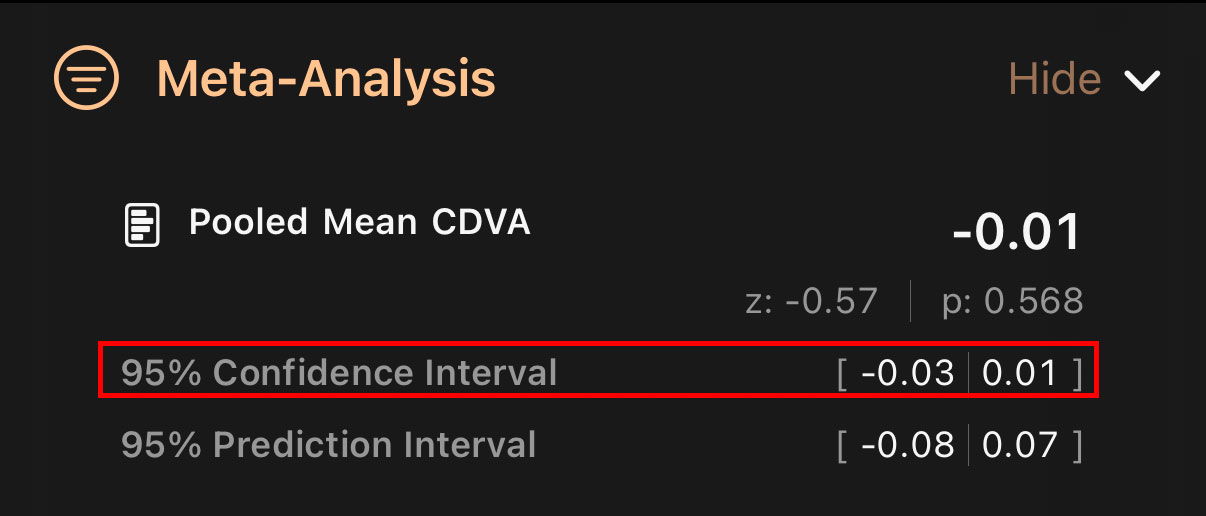
What it means:
It reflects the precision of the pooled estimate.
A narrow interval indicates that the average effect is estimated with high precision.
A wider interval indicates more uncertainty around the mean.
What it’s for:
To understand how tightly the data cluster around the combined mean.
To judge how confident you can be that the “true” average result lies close to that mean.
3.4.5. 95% Prediction Interval
The prediction interval also shows a range, but it answers a different question.
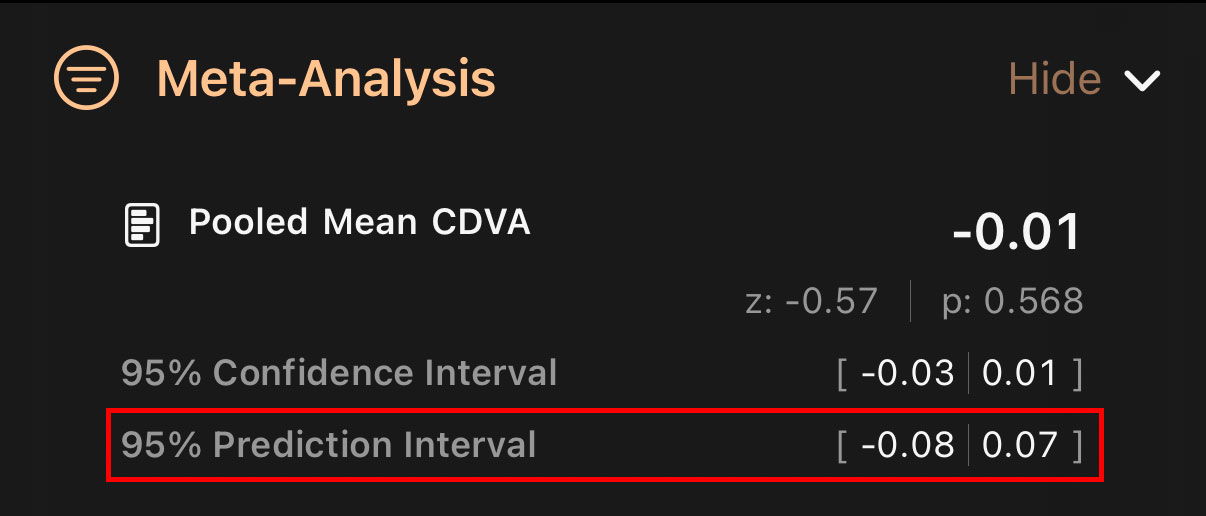
What it means:
It estimates the range of results that might be seen in a new, future study performed in real-world conditions.
It takes into account both the average effect and the differences between studies.
What it’s for:
To set realistic expectations about the variability you might see in your own clinic for a sample of patients.
To recognize that your outcomes could be better or worse than the pooled mean, depending on your population, technique and context.
3.4.6. Statistical Significance (z and p values)
Next to the combined mean you see a test statistic and a p value.
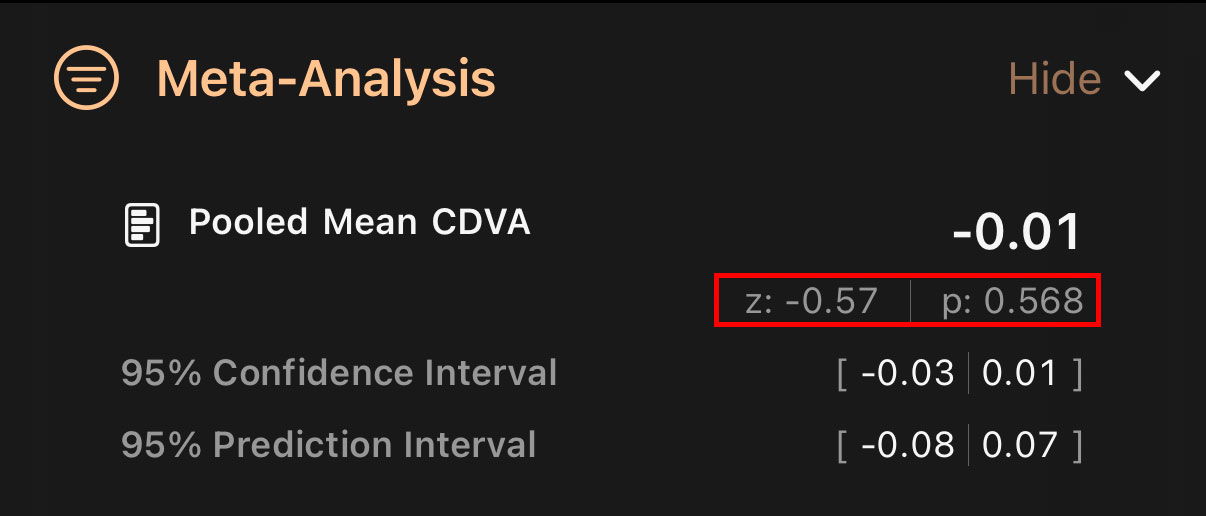
What it means:
The z statistic expresses how far the pooled mean is from the reference value (usually 0 for continuous outcomes such as logMAR), measured in standard errors. Values close to zero indicate that the pooled mean is very close to the reference.
The p value represents the probability of observing a pooled mean at least as extreme as the one obtained if the true mean were equal to the reference value.
What it’s for:
To assess whether the pooled mean is statistically different from the reference value (0).
To determine whether the observed pooled result is unlikely to be explained by random variation alone.
These statistics should always be interpreted together with the pooled mean itself and its confidence and prediction intervals, as statistical significance does not necessarily imply clinical relevance.
3.4.7. Heterogeneity Panel
This block describes how similar or different the report results are from each other. It is essential to know whether the IOL behaves consistently across different settings.

Key elements:
I²
Meaning: percentage of the total variation in study results that is due to real differences between studies rather than random noise.
Use: higher values mean greater inconsistency across studies; lower values mean studies are more similar.Tau-squared (τ²)
Meaning: an estimate of the variance in true effect sizes between studies.
Use: shows how much outcomes differ from one study to another beyond sampling error.Q Statistic
Meaning: a test that compares the observed variability between studies with what would be expected by chance.
Use: large values suggest meaningful heterogeneity.Degrees of Freedom (df)
Meaning: indicates how many independent pieces of information contribute to the heterogeneity statistics (typically related to the number of studies).
Use: provides context for interpreting Q and other tests.Chi-square (χ²) and p value
Meaning: provide a formal statistical test of whether the differences between study results are greater than would be expected by chance.
Use: a small p value supports the presence of real heterogeneity.
Overall purpose of the heterogeneity panel:
To help you judge whether the pooled result represents a stable effect across settings, or whether there is substantial variation hidden behind the average.
To remind you to interpret the combined mean with caution when studies are very heterogeneous.
3.4.8. Number of Studies and Eyes
At the bottom of the meta-analysis block you see how many studies and how many eyes are included.
What it means:
Number of studies: how many independent publications contributed data.
Number of eyes: total sample size across all studies.
What it’s for:
To gauge the volume and statistical power of the evidence.
Larger numbers usually strengthen confidence in the overall picture, though they must still be considered together with heterogeneity and study quality.
3.4.9. How to Use This Information in Practice
When you look at this section, you can follow this mental checklist:
Use the combined mean to see the typical performance of the lens.
Check the confidence interval to assess the precision of that estimate.
Check the prediction interval to understand the range you might see in your own clinic.
Look at the heterogeneity metrics to see how consistent the evidence is across different contexts.
Consider how many studies and eyes support these conclusions.
Together, these elements allow you to interpret published IOL evidence quickly and in a structured way, helping you make more informed, evidence-based clinical decisions.