1.3. Read a Confirmatory Report
1.3.1. Header Information
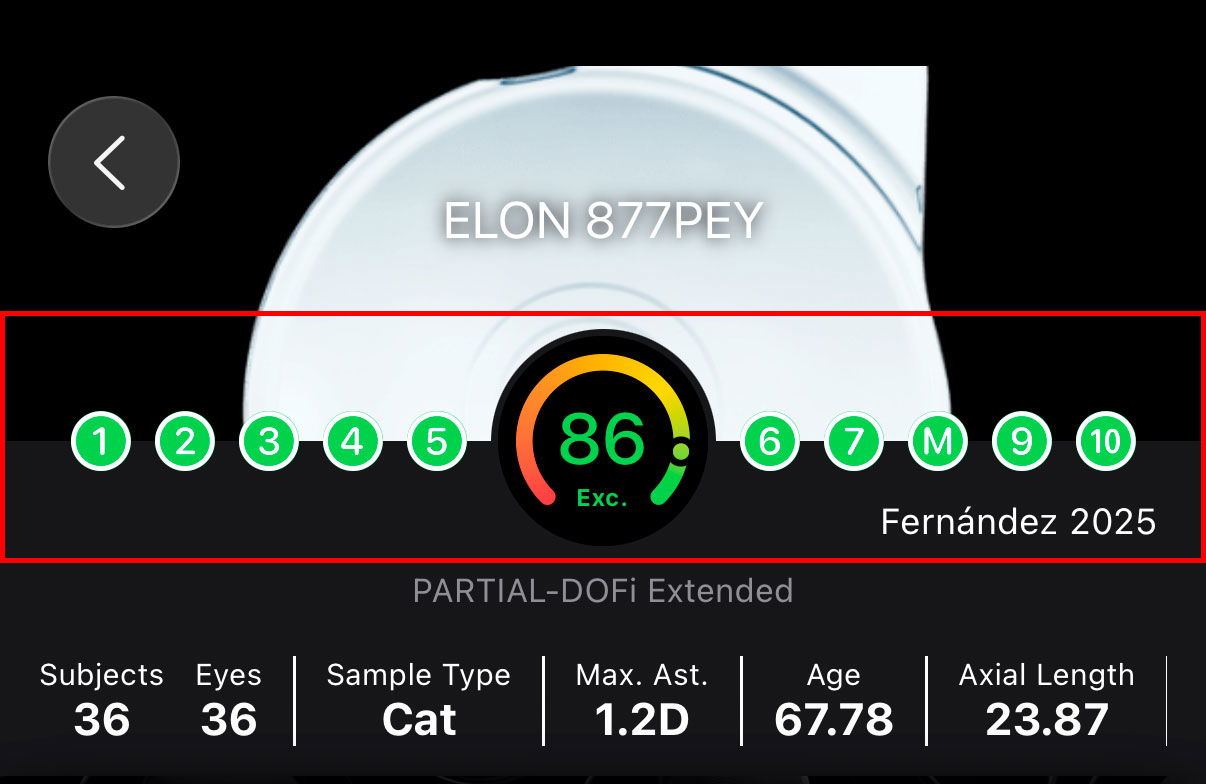
At the top of each Confirmatory Report, the user is presented with a concise summary of the most relevant contextual information needed to quickly understand the study and correctly interpret its results. This header is designed to provide, at a glance, an overview of the intraocular lens (IOL) being evaluated, the completeness of the reported evidence, and the key characteristics of the studied population.
The header includes the following elements:
IOL name: The commercial name and model of the intraocular lens evaluated in the report are prominently displayed, allowing immediate identification of the lens under analysis.
Score: A visual indicator displays the overall Score assigned to the report. This score summarizes how completely and transparently the study reports the essential methodological, demographic, and outcome-related information required for interpretation and comparison.
Domain-level evaluation: The evaluation of each of the ten domains used to calculate the Score is shown individually. This allows users to identify which aspects of the study are well reported and which domains contain missing or unclear information.
Reference information: The first author and year of publication are displayed to facilitate quick recognition of the study and its position within the scientific literature.
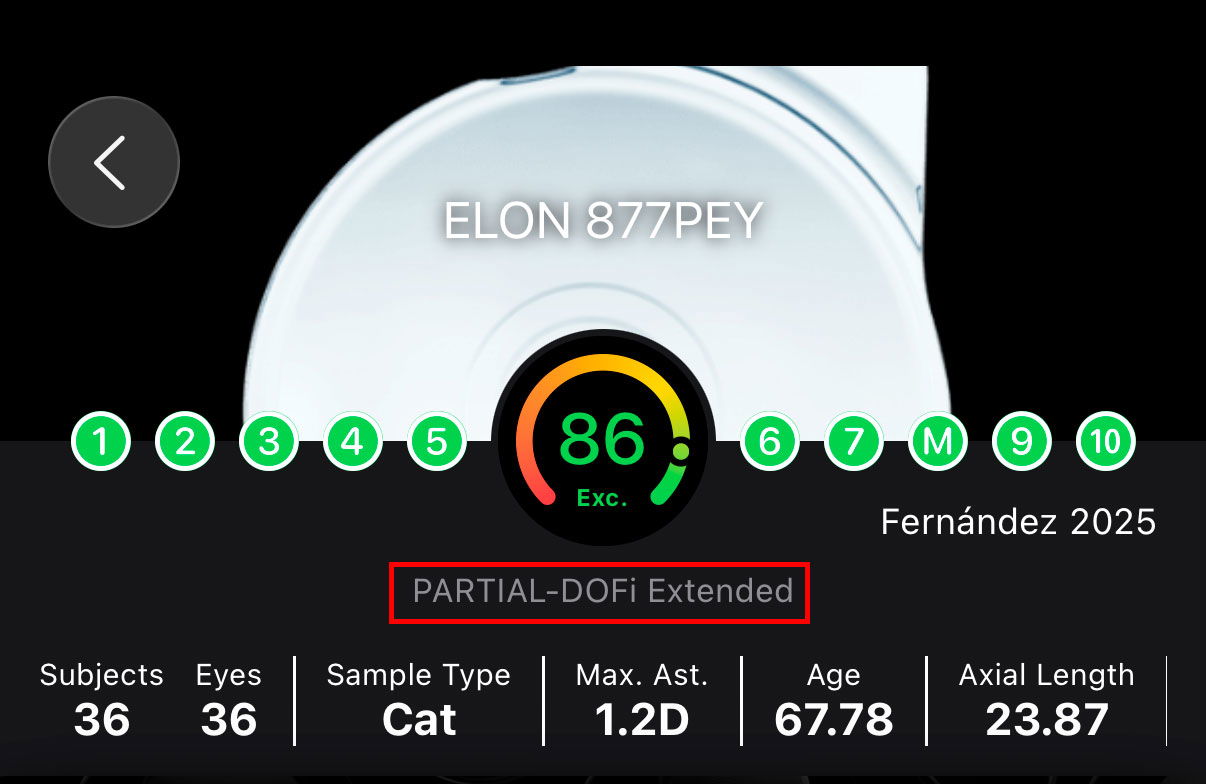
Functional classification: The functional classification assigned to the intraocular lens is shown, providing immediate context regarding the expected clinical behavior of the lens based on standardized outcome reporting.
Possible confounders: Key characteristics of the study population and design that may influence the reported outcomes are summarized, such as sample size, patient age, axial length, and inclusion criteria for corneal astigmatism. These elements help clinicians contextualize the results and assess their applicability to specific patient profiles.
1.3.1.1. What represents the Score?
The Score shown in the Confirmatory Report list (Reference) and within each Confirmatory Report reflects how completely, clearly, and transparently a study reports the key information required to interpret its results. It is based on an adaptation of the JBI Case Series Critical Appraisal Tool1, implemented as a structured checklist that evaluates whether essential elements are reported, such as inclusion criteria, baseline condition, demographic and clinical variables, outcome reporting details, follow-up information, study site characteristics, and the appropriateness of statistical reporting.
A higher Score indicates that the study provides more complete and standardized reporting, making its results easier to interpret, compare across studies, and include in evidence synthesis. A lower Score suggests that relevant information is missing, unclear, or inconsistently reported, which limits interpretability and reduces confidence when using the results for comparison, classification, or meta-analysis. Importantly, this Score does not function as a risk-of-bias assessment and does not judge whether study outcomes are biased; rather, it indicates how well the study reports the information needed to critically evaluate and use the evidence.
You can learn how to improve your score in our dedicated article.
1.3.1.2. What is the Functional Classification?
The Functional Classification is an evidence-based framework that categorizes intraocular lenses (IOLs according to their functional visual performance, rather than optical design alone. It is derived from standardized clinical outcomes, primarily monocular defocus curves and distance, intermediate, and near visual acuity, and reflects how an IOL behaves in real clinical conditions.
The classification is organized as a Continuum of Depth of Field (DOFi), progressing from lenses with minimal extension beyond distance vision to lenses providing continuous functional vision across multiple distances.
Functional Classification Scheme
Partial-DOFi IOLs provide a low to moderate extension of DOFi, resulting in a gradual increase in functional vision beyond distance. They are subdivided into:
Narrowed: No effective extension of DOFi, functionally equivalent to conventional standard monofocal IOLs.
Enhanced: A low extension of DOFi, resulting in a noticeable improvement in intermediate vision with limited near benefit.
Extended: A moderate extension of DOFi, resulting in a broader intermediate visual range and, in some patients, functional near vision.
Full-DOFi IOLs provide a high extension of DOFi, resulting in functional vision across distance, intermediate, and near ranges. They are subdivided into:
Steep: A high extension of DOFi, resulting in strong near vision with a steep transition between intermediate and near distances.
Smooth: A high extension of DOFi, resulting in balanced distance, intermediate, and near performance with smoother transitions between defocus points.
Continuous: A high and continuous extension of DOFi, resulting in a monotonous and gradual decrease in visual acuity from far to near vision.
The Functional Classification displayed in each Confirmation Report allows clinicians to rapidly understand where a given IOL sits within this continuum and to interpret study outcomes in relation to expected functional behavior.
1.3.1.3. What are the Reported Confounders
Reported confounders are study characteristics that can influence clinical outcomes independently of the IOL itself. These variables are summarized in the header to support correct interpretation and to help clinicians assess whether results are applicable to their own patients.

Common Confounders and Their Impact
Number of eyes and subjects (Sample Size): Differences between eyes-based and patient-based analyses can influence reported averages and variability.
Sample Type: Cataract (Cat), Refractive Lens Exchange (RLE) or both Cat & RLE.
Corneal astigmatism inclusion criteria: The magnitude of preoperative corneal astigmatism allowed in a study directly affects uncorrected visual acuity results, especially if toric correction is not used.
Age: Age affects neuroadaptation, contrast sensitivity, pupil behavior, and patient-reported outcomes. Older populations may show different performance profiles compared to younger cohorts.
Axial length: Axial length is associated with refractive predictability and optical performance. Studies including highly myopic or hyperopic eyes may show different outcomes.
Baseline visual acuity: Preoperative CDVA influences postoperative gain and ceiling effects. Studies with poorer baseline vision may report larger improvements.
Surgical planning and targeting: Planned refractive target (e.g., emmetropia vs micro-monovision) and its variability can alter reported functional results.
Presence of ocular comorbidities: Inclusion or exclusion of conditions such as macular disease, glaucoma, or dry eye can markedly affect outcomes if not clearly defined.
Additional incisions: Additional corneal incisions performed for correcting corneal astigmatism.
These confounders are not used to adjust or modify outcomes within IOLEvidence. Instead, they are presented transparently to allow clinicians to contextualize results, distinguish true lens-related effects from population- or methodology-driven variability, and make informed, evidence-based decisions.
1.3.2. Visual Performance Outcomes
1.3.2.1. IOL and Procedure Efficacy
IOL Efficacy and Procedure Efficacy describe two complementary but conceptually different aspects of clinical outcomes reported in Confirmatory Reports.
IOL Efficacy refers to the visual performance attributable primarily to the optical properties of the IOL itself. It is assessed using Monocular Corrected Distance Visual Acuity (CDVA), isolating the lens’ optical behavior by minimizing the influence of residual refractive error and surgical targeting. For this reason, IOL Efficacy outcomes are the most appropriate metrics for classifying IOLs and understanding their intrinsic functional performance under standardized conditions.
Procedure Efficacy, in contrast, reflects the overall effectiveness of the surgical procedure, integrating the IOL, surgical technique, refractive accuracy, and intended refractive strategy. It is assessed using Binocular Uncorrected Distance Visual Acuity (UDVA), capturing the real-world visual performance experienced by patients after surgery. Because procedure efficacy is influenced by surgical decisions, such as the use of mini-monovision, refractive targeting, or patient selection, it should not be used to classify an IOL, as it does not isolate the lens’ optical contribution.
From a Clinical Perspective, however, Procedure Efficacy represents the most relevant outcome for patients, as it is closely linked to Spectacle Independence and Functional Vision in daily life. Surgeons can intentionally modify the procedure to enhance or shift the expected functional performance of a given IOL, even when the intrinsic IOL efficacy remains unchanged. Therefore, while IOL Efficacy is essential for classification and evidence synthesis, Procedure Efficacy guides clinical decision-making and patient counseling, bridging evidence with real-world outcomes.
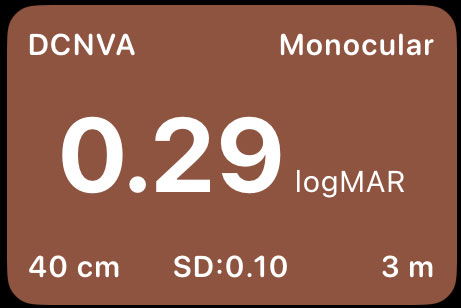
The visual acuity card displayed in the report summarizes these outcomes in a standardized and intuitive format:
Top right – Eye testing conditions:
Monocular: IOL Efficacy for visual acuity with distance correction.
Binocular: Procedure Efficacy for visual acuity without distance correction.
Top left – Visual acuity measurement type:
Indicates the specific visual acuity endpoint being reported. Common abbreviations include:CDVA: Corrected Distance Visual Acuity
DCIVA: Distance-Corrected Intermediate Visual Acuity
DCNVA: Distance-Corrected Near Visual Acuity
UDVA: Uncorrected Distance Visual Acuity
UIVA: Uncorrected Intermediate Visual Acuity
UNVA: Uncorrected Near Visual Acuity
Center – Visual acuity value:
The mean visual acuity of the sample, expressed in logMAR, allowing standardized comparison across studies. We recommend you to get familiar with logMAR notation since it is the easier understandable metric in which a change of 0.1 logMAR corresponds to a change in a line of visual acuity. You can see a conversion table here.Bottom left – Measurement distance:
The testing distance at which visual acuity was assessed (e.g., 40 cm for near, 66–80 cm for intermediate, or 3–4 m for distance). Moreover, standard distances are 4m, 66cm and 40cm.SD – Standard deviation:
Represents the variability of visual acuity outcomes within the study sample, providing insight into the consistency of results.Bottom right – Follow-up period:
Indicates the postoperative follow-up time (in months) at which the measurement was obtained, helping contextualize stability and neuroadaptation effects. (Recommended equal or higher than 3 months and minimum 1 month).
1.3.2.2. Defocus Curve
The defocus curve represents visual acuity across a range of defocus levels (in diopters), providing a functional description of how an IOL performs from distance to near vision. It is a key tool for understanding and classifying the Functional Depth of Field (DOFi) of an IOL.
In the defocus curve displayed in IOLEvidence, three curves may be shown (depending on the reported in the study): monocular, binocular, and standardized. Each one serves a distinct purpose in interpretation and classification.
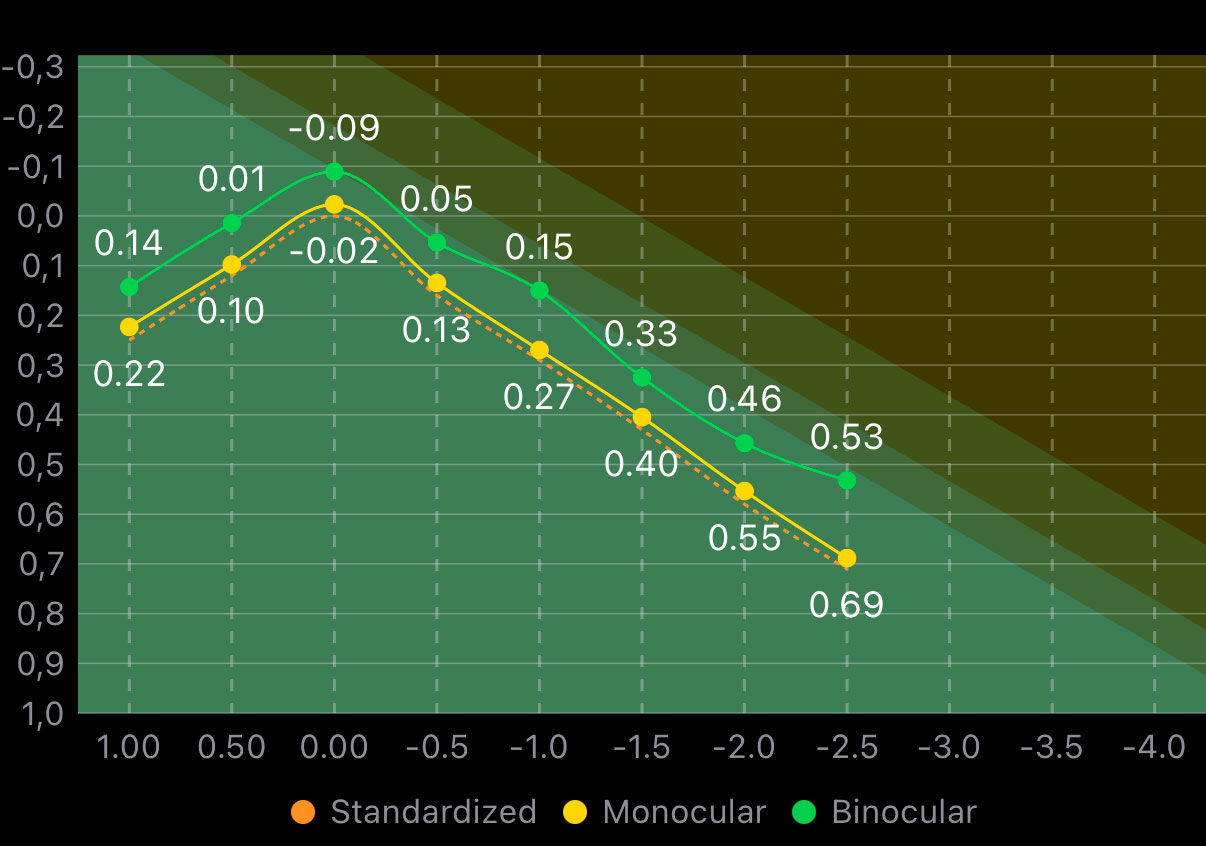
1.3.2.2.1. Shadowed areas
The colored shadowed areas in the background represent the Functional Classification Zones. These zones define the expected ranges of visual acuity for different functional IOL categories across defocus levels. By overlaying the reported defocus curves onto these areas, users can visually assess how closely the observed performance matches a given functional classification and identify where transitions between categories occur.
From left to right, these zones should be interpreted as follows:
Partial-DOFi Narrowed zone displayed in bright green.
Partial-DOFi Enhanced zone shown as a small adjacent area in darker green.
Partial-DOFi Extended zone represented by a wider region in the darkest green.
Full-DOFi zone displayed as a dark orange area covering the remaining portion of the plot.
These background zones provide a visual reference framework that helps distinguish intrinsic IOL functional behavior from study-specific variability, supporting accurate classification and consistent interpretation of defocus curve data.
1.3.2.2.2. Monocular and binocular curves
The monocular defocus curve reflects the visual performance of one eye and is more sensitive to optical limitations of the IOL.
The binocular defocus curve incorporates binocular summation and neuroadaptation effects, typically showing better visual acuity across defocus levels. While clinically relevant, binocular curves are more influenced by patient-related factors and therefore no suitable for lens classification.
1.3.2.2.3. What “Standardized” defocus curve means?
In healthy populations reporting standardized outcomes, all functional IOL categories converge to a corrected distance visual acuity (CDVA) around 0 logMAR ± 1 letter at 0 D defocus. However, defocus curves reported in individual clinical studies often deviate from this reference, frequently shifting by ±1 line (≈0.1 logMAR). These shifts might not be caused by the IOL itself, but by confounding factors such as measurement methods, testing conditions, patient age, or sample characteristics.
The standardized (or normalized) defocus curve corrects for this systematic offset by shifting the curve so that visual acuity at 0 D equals 0 logMAR before functional classification. This normalization step does not modify the shape of the curve; it only removes global bias, allowing a fair comparison across studies and an accurate classification of the IOL’s intrinsic functional behavior.
In practice, this means:
The standardized defocus curve is used exclusively for the functional classification of the IOL, as it minimizes the influence of confounding factors and allows consistent comparison across studies. Remember, this is only for classification purposes assuming that a mean CDVA far away from 0 logMAR is more probably due to study bias than real performance.
The non-standardized monocular and binocular defocus curves represent the actual visual performance observed in the specific study sample. These curves reflect real-world outcomes and should therefore be the primary reference when interpreting results for clinical decision-making and patient counseling.
1.3.2.3. Contrast Sensitivity
The Contrast Sensitivity section evaluates visual quality beyond high-contrast visual acuity by assessing the ability to detect patterns of different sizes at varying contrast levels. This measurement is particularly relevant in the assessment of IOLs, as optical design features that extend depth of field may differentially affect contrast perception even in 20/20 vision.
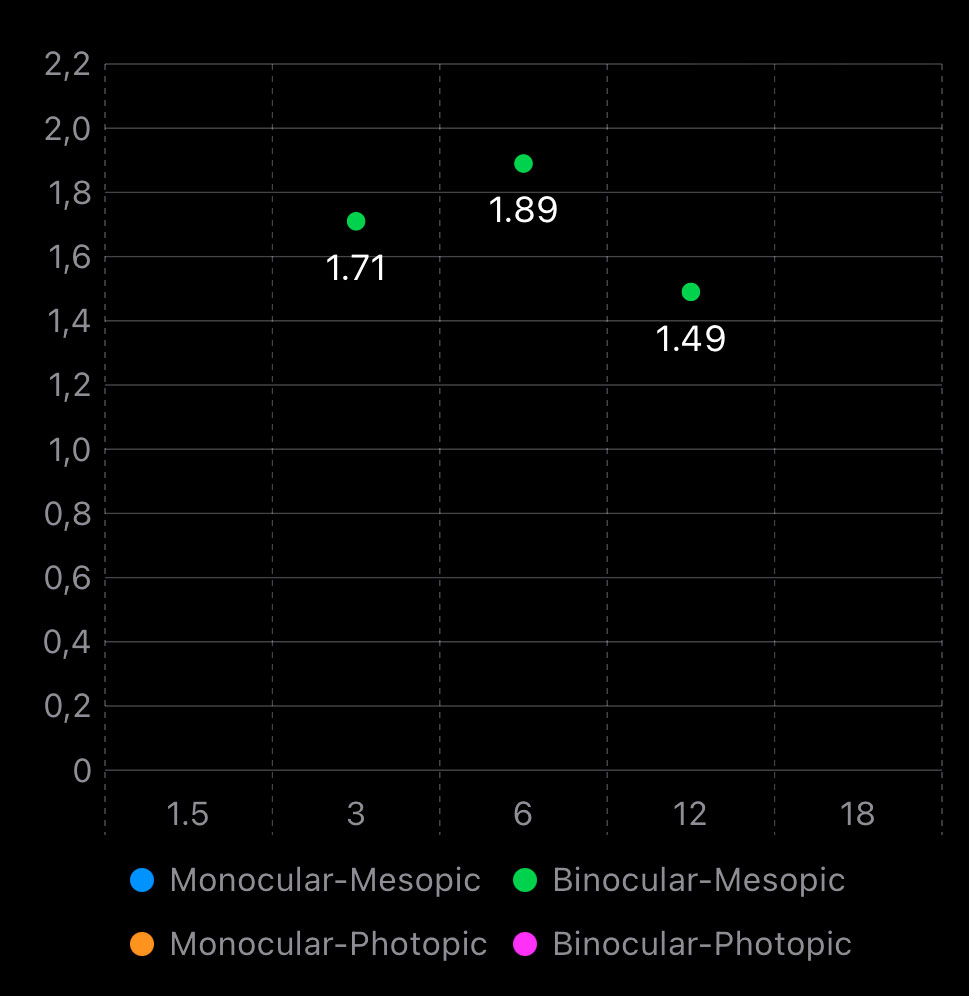
From a clinical and scientific perspective, high spatial frequencies (18 cpd) are the most relevant for evaluating and comparing IOLs. These frequencies are more sensitive to optical degradation, light distribution, aberrations, and diffractive effects introduced by Simultaneous Vision IOLs. Differences between IOLs that may not be evident in low or mid spatial frequencies often become apparent at high frequencies, making them particularly useful for detecting subtle losses in visual quality and contrast performance.
Lower spatial frequencies (1.5–3 cpd) are generally preserved across most IOL designs and frequently fall within normal ranges, even in Full-DOFi IOLs. As a result, they are less discriminative when comparing lenses and should be interpreted cautiously when used in isolation. Mid frequencies (around 6 cpd) may show differences in some comparative studies, but findings are often inconsistent across publications.
The graph displays contrast sensitivity values for monocular and/or binocular performance as well as photopic and/or mesopic conditions. Reduced contrast sensitivity under mesopic conditions, particularly at high spatial frequencies, is clinically relevant as it relates to patient complaints in low-light environments (e.g., night driving), and may reflect the combined effect of IOL optics and neural summation mechanisms.
1.3.3. Patient Reported Outcomes
Patient-Reported Outcomes (PROs) summarize how patients perceive and experience their vision after intraocular lens (IOL) implantation. In IOLEvidence, this section includes studies that report the frequency of responses to standardized questionnaire items, typically collected using Likert-type scales. To improve comparability across studies, responses are harmonized by collapsing the highest severity or agreement levels when appropriate (for example, in a 5-point scale, the two highest categories are combined). Results are presented as percentages, allowing direct interpretation and comparison between lenses and studies.
1.3.3.1. Spectacle Independence
Spectacle Independence reports the percentage of patients who never use spectacles after surgery. This outcome is presented separately for three visual domains: distance, intermediate, and near vision. The reported value corresponds to the proportion of patients achieving complete independence at the specified distance.
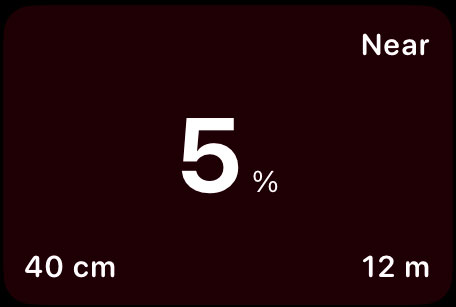
In the card view:
Top right indicates the visual range being evaluated (distance, intermediate, or near).
Bottom left specifies the exact testing distance.
Bottom right shows the follow-up time in months.
This metric provides a direct estimate of postoperative spectacle dependence and is one of the most clinically relevant outcomes for patient counseling.
1.3.3.2. Photic Phenomena and Positive Dysphotopsia
This subsection differentiates between photic phenomena and positive dysphotopsia, two related but distinct concepts. Photic phenomena refer to the perception of light artifacts (such as halos, glare, or starbursts), whereas positive dysphotopsia refers specifically to those artifacts that are bothersome to the patient. Importantly, not all perceived photic phenomena result in dysphotopsia.
Results are reported as:
The percentage of patients perceiving a given light artifact (photic phenomena).
The percentage of patients bothered by those artifacts (positive dysphotopsia).
As expected, the proportion of patients with positive dysphotopsia is lower than the proportion perceiving photic phenomena.
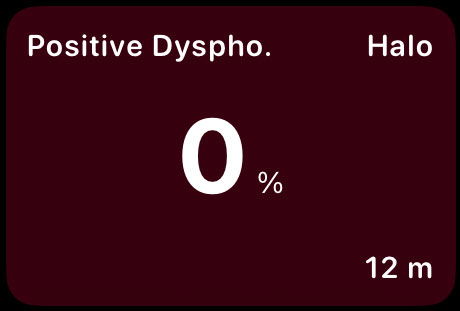
In the card view:
Top right describes the photic phenomena or dysphotopsia type.
Bottom right shows the follow-up time in months.
1.3.3.3. General Satisfaction
General Satisfaction summarizes the overall subjective evaluation of visual outcomes after surgery. It is derived from questionnaire items assessing how satisfied patients are with their vision or with the surgical result as a whole. Responses are harmonized by collapsing higher agreement or satisfaction categories and expressed as cumulative percentages. Take into account that this end-point is highly dependent on management of expectation by surgeons, specitally in retrospective studies.
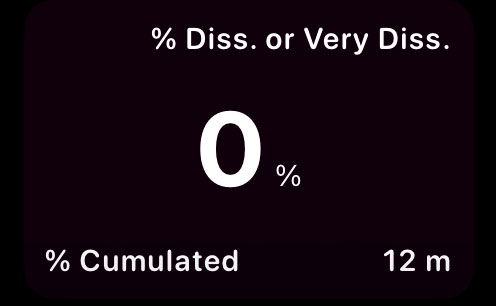
In the card view:
Top right describes the collapsed satisfaction categories.
Bottom left indicates that the value represents a cumulative percentage.
Bottom right shows the follow-up time in months.
This outcome provides a global measure that integrates visual performance, visual symptoms, and patient expectations.
1.3.3.4. Same IOL or Recommendation
This outcome reflects the likelihood that patients would choose the same IOL again or would recommend the procedure to others. It is considered a robust summary indicator of patient acceptance, as it implicitly integrates visual performance, visual symptoms, and overall satisfaction.
Results are presented as the cumulative percentage of patients expressing agreement with repeating or recommending the procedure.
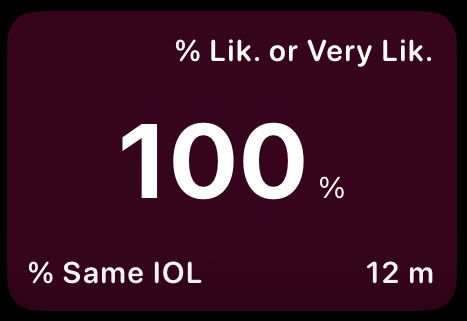
In the card view:
Top right describes the collapsed response categories.
Bottom left indicates that the value represents a cumulative percentage.
Bottom right shows the follow-up time in months.
This metric is particularly useful for understanding real-world acceptance and long-term patient perception of the procedure.