4.1. Understanding IOLEvidence Score
4.1.1. What IOLEvidence Score can (and cannot) tell us
This section explains, in clinician-friendly terms, what “bias” means in a meta-analysis and how to interpret two common ways of judging study trustworthiness. We then show a real example (Fernández et al., Eye, 2025) where these judgements relate, at least in this dataset, to how much each study’s result differs from the overall (“pooled”) estimate for Distance Corrected Intermediate Visual Acuity (DCIVA).
The key message is simple: these tools do not prove that a study is biased. They help us estimate how confident we should be in a study’s results and how likely it is that the result could be affected by systematic issues.
What “bias” means here
In this context, bias means systematic error, something in the design, conduct, analysis, or reporting that could push results consistently in one direction, away from the truth. This is different from random variation, which happens naturally when sample sizes are small or measurements are noisy.
Because we rarely observe “true bias” directly, we use critical appraisal tools to judge risk.
Two types of tools clinicians often see (and why they’re different)
It helps to separate two ideas that often get mixed:
Risk-of-bias / critical appraisal tools (methodology and internal validity)
These ask: Could the way the study was done create a systematically distorted result?
RoB 2 is one of these tools and is mainly used for group-comparison trials (especially randomized controlled trials).
It assigns Low risk, Some concerns, or High risk of bias depending on whether there are plausible “routes” to bias (e.g., problems with randomization, deviations from assigned treatment, missing data, outcome measurement, selective reporting).
A High risk label means bias is plausible, not that it definitely happened, and it does not tell you how big the bias is or which direction it goes.
Reporting checklists / guidelines (clarity and transparency)
These ask: Did the authors describe what they did clearly enough for us to understand and judge it?
Good reporting makes a study easier to interpret and appraise. But good reporting does not automatically mean low bias, and poor reporting does not automatically mean bias, it can simply create uncertainty.
Where IOLEvidence fits: a hybrid tool by design
The IOLEvidence Score was developed specifically for IOL evidence synthesis and is designed as a hybrid:
it includes critical appraisal elements that reflect methodological robustness and vulnerability to bias, and
it includes reporting-related elements that capture whether key IOL-relevant details are reported clearly enough to trust and interpret the findings.
So, a lower IOLEvidence Score does not mean “this study is biased.” It means the study shows fewer reliability signals, because of design limitations, incomplete reporting, or both, which can make the estimate less dependable.
What we compared in Fernández et al. (Eye, 2025)
To see whether IOLEvidence behaves like a useful indicator of robustness, we compared it to two “external references” within the same meta-analysis:
each study’s RoB 2 judgement, and
each study’s standardized distance from the pooled mean for DCIVA.
Think of standardized distance as: “How far is this study’s result from the overall average result?”
It is not a “bias meter.” A study can be far from the pooled mean because:
patients, lenses, follow-up, or methods truly differ (real heterogeneity),
the study is small and results fluctuate (random variation), or
sometimes, systematic issues influence the result (possible bias).
That’s why correlations between “risk tools” and distance from the pooled mean can happen, but do not have to happen in every meta-analysis.
4.1.2. IOLEvidence Score aligns with RoB 2 categories
In the first plot (boxplots), studies judged Low risk by RoB 2 generally have higher IOLEvidence Scores, while High risk studies tend to have lower scores. The Some concerns group sits between them, with a few low-scoring outliers.
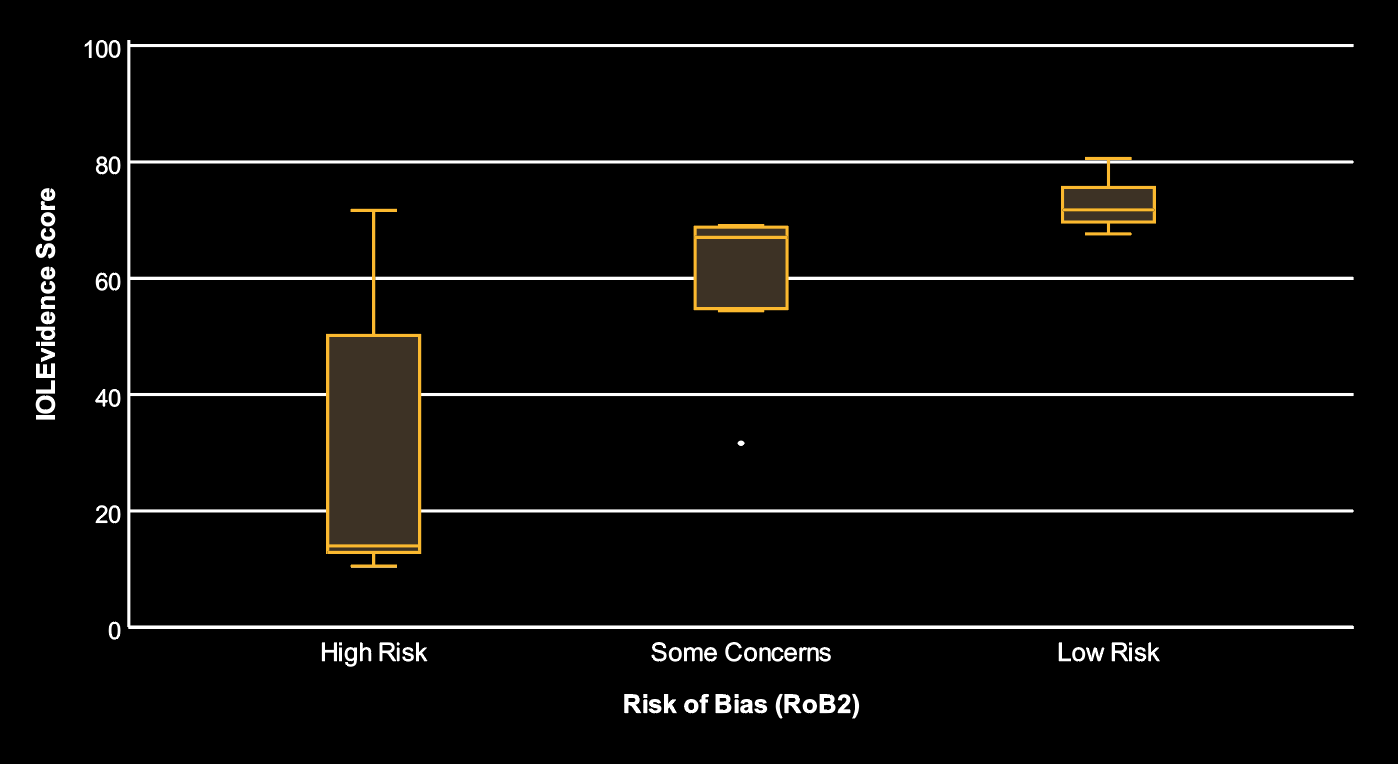
Interpretation: the two approaches broadly agree in direction. When RoB 2 suggests fewer methodological concerns, IOLEvidence Score often indicates stronger reliability signals. When RoB 2 suggests more concerns, IOLEvidence Score often decreases. This supports the idea that IOLEvidence captures information related to study robustness.
4.1.3. RoB 2 does not cleanly separate “distance from the pooled mean” (and that’s expected)
In the second plot, each point is a study’s standardized distance from the pooled DCIVA estimate. Larger values mean the study is more different from the average meta-analytic result.
Across RoB 2 categories, there is substantial overlap. Some Low risk studies are still far from the pooled mean, and some High risk studies are not especially far.
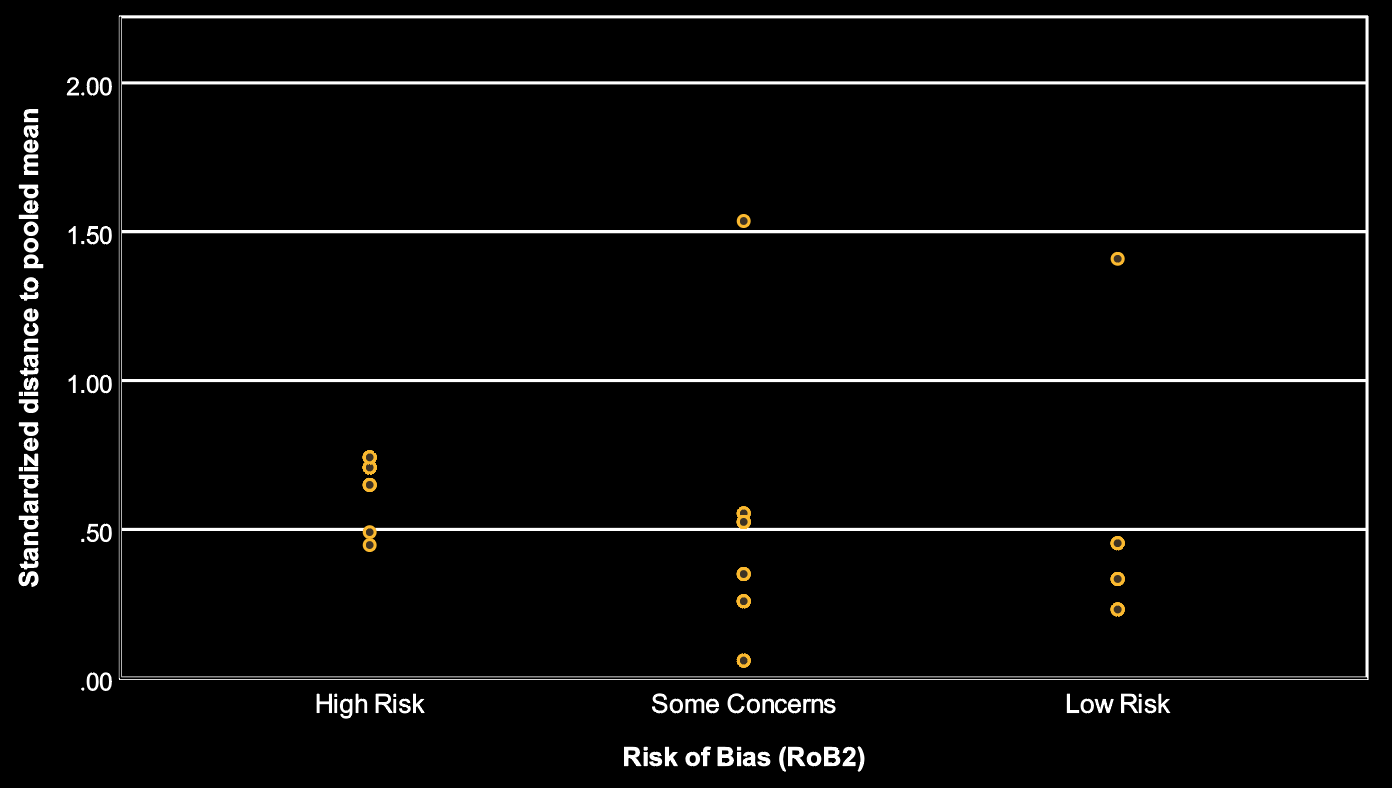
Interpretation: this does not contradict RoB 2. RoB 2 is not designed to predict how close a study must be to the pooled estimate. A well-conducted study can legitimately differ from the pooled mean (because populations or procedures differ), and a high-risk study can still land near the pooled mean (because bias may be small, inconsistent, or coincidentally aligns with the average). Therefore, RoB 2 alone will often be only a modest separator of “how extreme” a study looks.
4.1.4. In this dataset, higher IOLEvidence Score is linked to results closer to the pooled estimate
In the third plot, the overall trend is negative: as IOLEvidence Score increases, the standardized distance from the pooled mean tends to decrease.
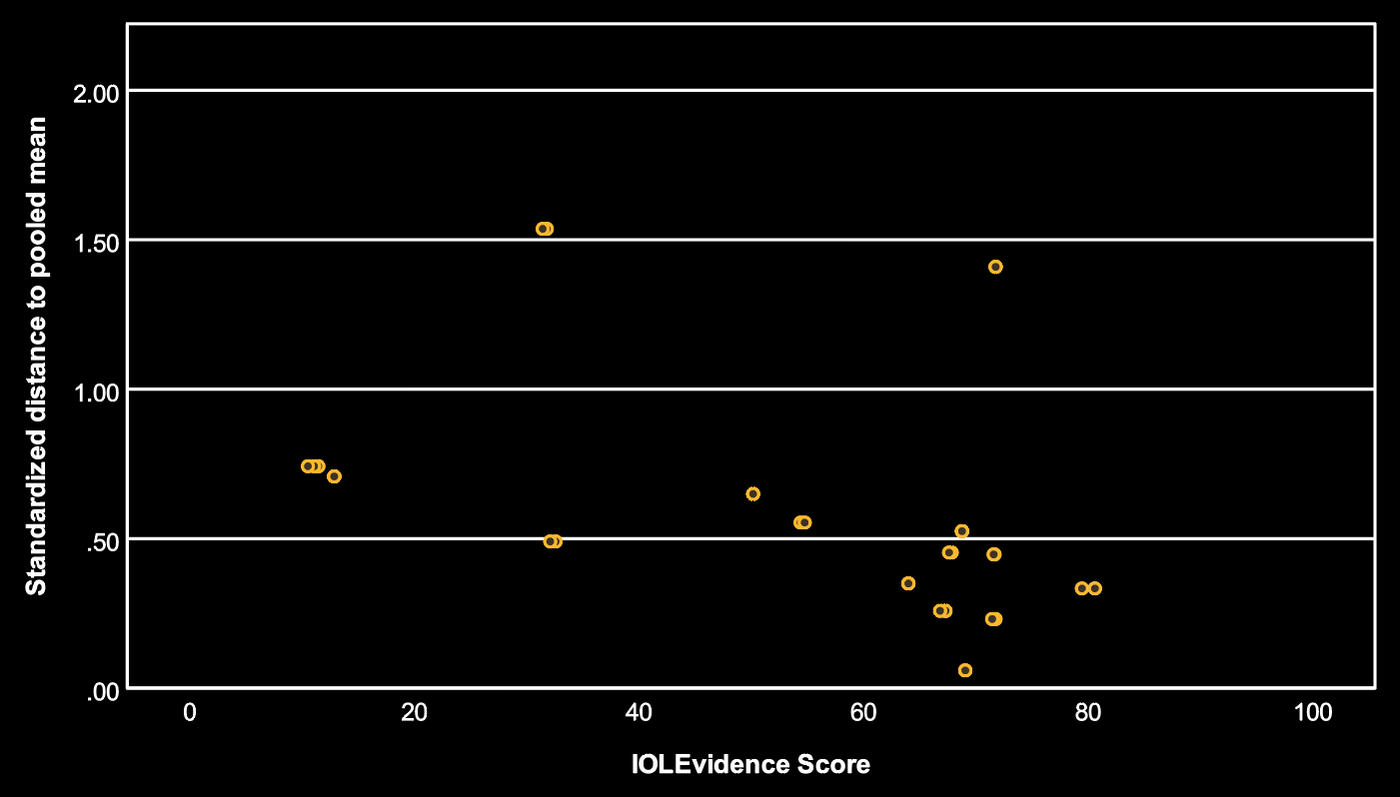
Interpretation: in this meta-analysis, studies with more reliability signals (higher IOLEvidence Score) tend to produce results that are less “outlying” relative to the pooled DCIVA estimate. Importantly, this does not mean that low-scoring studies are biased or wrong. It means that, here, lower scoring studies are more often the ones that produce more extreme results, which can happen for many reasons (heterogeneity, small samples, or systematic issues).
This pattern may or may not appear in other meta-analyses.
4.1.5. Quantifying the relationships (simple take-home meaning)
Using the correlation results:
Standardized distance vs IOLEvidence Score: Spearman ρ = −0.571, p < 0.001
Meaning: a clear inverse relationship in this dataset: higher IOLEvidence Score → results tend to be closer to the pooled mean.Standardized distance vs RoB 2: Spearman ρ = −0.358, p = 0.035
Meaning: a weaker inverse relationship: RoB 2 categories also relate to how far a study is from the pooled mean, but less strongly than IOLEvidence in this dataset.
Clinical interpretation: both tools show some alignment with “distance from pooled mean” here, but IOLEvidence aligns more strongly.
4.1.6. Summary
RoB 2 and IOLEvidence do not prove bias; they indicate risk and reliability, and help us judge how much confidence to place in each study.
IOLEvidence is intentionally hybrid: it combines elements of critical appraisal (risk of bias) and reporting quality (clarity and completeness), tailored to IOL studies.
This is best interpreted as: in this dataset, IOLEvidence helps rank studies by likely robustness, while recognizing that:
being far from the pooled mean does not automatically mean bias, and
a correlation between appraisal tools and pooled-distance can occur, but is not guaranteed in every meta-analysis.
Fernández, J., Ribeiro, F., Burguera, N., Rodríguez-Calvo-de-Mora, M. & Rodríguez-Vallejo, M. Visual and patient-reported outcomes of an enhanced versus monofocal intraocular lenses in cataract surgery: a systematic review and meta-analysis. Eye 1–16 (2025)